Recently I was asked to teach about sentencing in impaired driving cases. I thought the audience might want to know not just the law governing sentencing for impaired driving but also what sentences typically are imposed in those cases. For the latter, I turned to the North Carolina Sentencing and Policy Advisory Commission’s Fiscal Year 2020 Statistical Report on Driving While Impaired convictions. There one can find information about the percentages of impaired driving convictions sentenced at each of the six levels of punishment under G.S. 20-179, the types of sentences imposed by sentencing level, average sentence length for active and suspended sentences, and the average days of special probation (imprisonment) ordered by punishment level — among other data. Read on for highlights from the report, which contains data about convictions under G.S. 20-179 from July 1, 2019 through June 30, 2020.
Convictions under G.S. 20-179. The following offenses are sentenced under G.S. 20-179:
- Impaired driving (G.S. 20-138.1);
- Impaired driving in a commercial vehicle (G.S. 20-138.2);
- A second or subsequent conviction for operating a commercial vehicle after consuming alcohol (G.S. 20-138.2A); and
- A second or subsequent conviction for operating a school bus, school activity bus, child care vehicle, ambulance, other EMS vehicle, firefighting vehicle, or law enforcement vehicle after consuming alcohol (G.S. 20-138.2B).
The North Carolina Sentencing and Policy Advisory Commission’s Fiscal Year 2020 Statistical Report on Driving While Impaired Convictions [hereinafter “the report”] included all convictions sentenced under G.S. 20-179, other than convictions for aiding and abetting impaired driving. The convictions included in the report were referred to there and are referred to here as “DWI convictions.”
It is reasonable to assume that the vast majority of these convictions were for misdemeanor impaired driving under G.S. 20-138.1. In 2020, for example, there were 34,810 charges for impaired driving (G.S. 20-138.1), 40 charges for impaired driving in a commercial vehicle (G.S. 20-138.2), 10 charges for operating a commercial vehicle after consuming alcohol (G.S. 20-138.2A), and 1 charge for operating a school, child care, emergency or law enforcement vehicle after consuming alcohol (G.S. 20-138.2B). In 2019, there were 39,263 charges for impaired driving (G.S. 20-138.1), 53 charges for impaired driving in a commercial vehicle (G.S. 20-138.2), 18 charges for operating a commercial vehicle after consuming alcohol (G.S. 20-138.2A), and 2 charges for operating a school, child care, emergency or law enforcement vehicle after consuming alcohol (G.S. 20-138.2B).
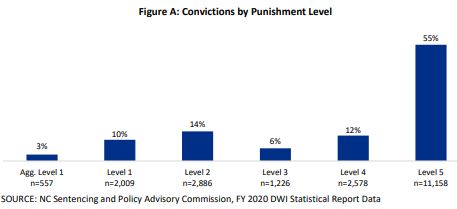
More than half of all DWIs were sentenced at Level Five. Because of the postponement of certain court proceedings during the COVID-19 pandemic, there were fewer DWI convictions in the fiscal year ending June 30, 2020 (20,414) than the previous year (27,591). Nevertheless, the percentage of DWIs sentenced at each level was the same, and Level Five convictions comprised the majority.
Nearly all sentences are probationary. Only 7 percent of DWI convictions resulted in an active sentence. The rest were probationary, with 59 percent of convictions receiving unsupervised probation.
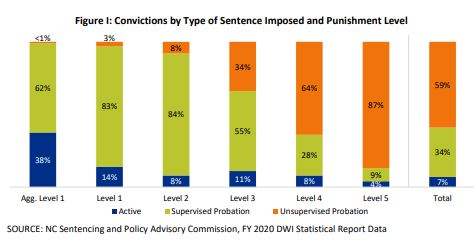
Not surprisingly, the highest percentage of active sentences was among defendants sentenced at Aggravated Level One. At the four highest levels of sentencing (Aggravated Level One, Level One, Level Two, and Level Three), most probationary sentences were supervised rather than unsupervised. The opposite was true for Level Four and Five sentences.
Active sentences are shorter than probationary sentences. The report compared average sentence lengths for active and probationary sentences, noting that suspended sentences were longer than active ones for every sentence level.

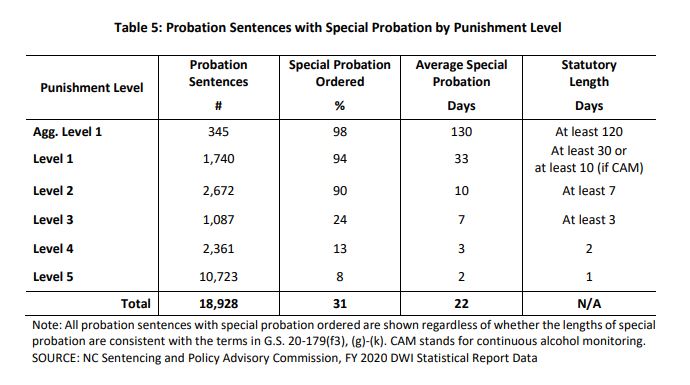
The report also includes the average days of confinement ordered as a condition of special probation at each level.
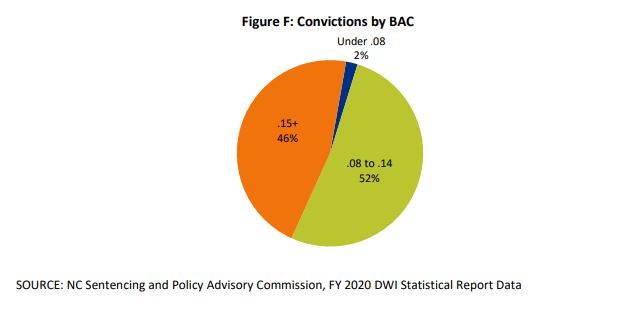
The most frequently recorded BAC was 0.11. Fifty-two percent of convictions for which a BAC level was recorded had a BAC in the .08 to .14 category. Forty-six percent of convictions with a recorded BAC had a BAC of .15 or greater.
Most convictions followed a guilty plea. The report stated that 87 percent of DWI convictions were disposed by guilty plea, 12 percent by bench trial, and 1 percent by jury trial. Of these convictions, Aggravated Level One convictions had the highest percentage of guilty pleas, while Level Five convictions had the lowest.
Because the report is based on convictions, it does not account for the number of charges that might have been disposed of in other ways, including a not guilty verdict. Statistics compiled by the Administrative Office of the Courts for the 2017 fiscal year reflect that 7 percent of the DWI dispositions that year were not guilty verdicts, 4 percent were magistrate findings of no probable cause, 22 percent were voluntary dismissals by the prosecutor, and 7 percent were dismissed with leave. [Convictions for Habitual Impaired Driving (G.S. 20-138.5) and aiding and abetting impaired driving (punished pursuant to G.S. 20-179(f1)) were included in the 2017 statistics but not in the report.] If dispositions today continue to break down along similar lines, most DWI charges (in addition to convictions) are disposed of by guilty plea rather than by trial.
Be sure to check out the full report for its comprehensive analysis and informative charts and tabulations. Hats off to the Commission’s talented staff for creating yet another enlightening report.