
It’s a chilly, blustery day in Chapel Hill, but I see signs of spring. The days are getting a little longer. College basketball season kicks into high gear tonight. And there are only four days until pitchers and catchers report. But one of my favorite signs that we’ve completed another trip around the sun and are starting to tilt toward it has also arrived: the North Carolina Sentencing and Policy Advisory Commission has issued its annual Statistical Report for Felonies and Misdemeanors.
This year’s report covers sentencing episodes from July 1, 2015 to June 30, 2016. Here are some things that jumped out at me.
- As usual, about a quarter of all felony convictions come from two grid cells: Class H/Level I and Class H/Level II. Those two grid cells alone account for more convictions than the entire grid from Class F to Class A—or as I like to call it, the Wyoming of the sentencing grid (a big rectangle with lots of space but few people).
- Our most populous county, Mecklenburg (population of just over 1,000,000), does not have the highest number of sentencing episodes. Not even close, actually. Mecklenburg had 1,556 felony convictions and 3,457 misdemeanor convictions. Wake County (approximate population 1,000,000) had 2,134 felony convictions and 7,824 misdemeanor convictions, the most of both types statewide. Guilford County (approximate population 500,000) had more felony convictions than Mecklenburg, and both Guilford and Forsyth (approximate population 365,000) had more misdemeanor convictions.
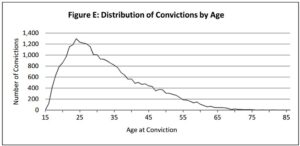
- The distribution of felony offenders by age confirms the conventional wisdom that many people begin to age out of criminal activity in their twenties. Some of the science behind that trend is discussed here, including an argument for how it could fit into our approach to sentencing.
- The presumptive/mitigated/aggravated slash line held steady at 69/27/4. So even if it seemed like you were thoughtfully balancing those aggravating and mitigating factors in each case, you collectively did exactly what you did last year. (Just like the Sentencing Commission’s annual prison population algorithm knew you would!)
- There were 79 Advanced Supervised Release sentences imposed in this reporting period, down from 90 last report.
- Death sentences held steady at 1. Life without parole sentences climbed from 54 to 63. Two defendants under age 18 at the time of their offense received sentences of life with parole (down from 5 last report).
- Habitual felon sentences climbed from 873 to 914. There were 158 habitual breaking and entering convictions, about the same as last report (154).
- Drug trafficking convictions dropped from 530 to 435.
- There were 5 convictions obtained through a bench trial in superior court using the jury trial waiver Jeff described here, which is about the same as last report (6).
- The firearm enhancement was not used a single time. It was used twice last report, and 7 times the year before that.
- The percentage of Class H and I felonies pled in district court ticked up from 26 percent to 27.
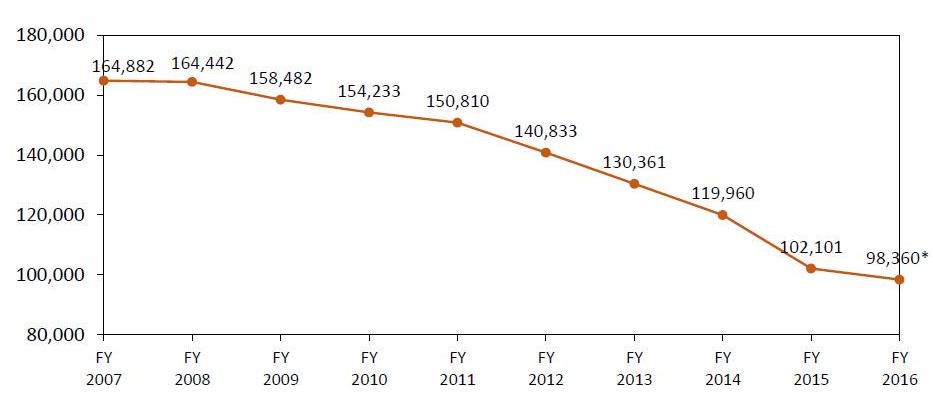
- Finally, the total number of misdemeanor sentencing episodes dipped below 100,000. Check out the 10-year trend on misdemeanor convictions.
I recommend reading the full report. And as always, I thank the Sentencing Commission staff for their thoughtful and careful work in preparing it.
