With the work of the Governor’s Task Force for Racial Equity in Criminal Justice under way, it is timely to consider the issue of racial equity in the juvenile justice system. Issues of racial and ethnic disproportionality and disparity in juvenile justice have been discussed and studied in juvenile justice systems across the country for decades, as federal juvenile justice funding for states has long been tied to their study. See the U.S. Department of Justice, Office of Juvenile Justice and Delinquency Prevention’s Racial and Ethnic Disparities page for more information on the federal requirement.
North Carolina’s most recent study, Disproportionate Minority Contact in North Carolina: An Assessment Study (hereinafter “Assessment Study”), funded by the Governor’s Crime Commission and authored by Stan Orchowsky, Ph.D. of Cambiare Consulting and Michael Leiber, Ph.D., and Chae Jaynes, Ph.D., of the University of South Florida, was released in June of 2019. The findings reveal that, while there is significant local variation across counties in North Carolina, youth of color are represented throughout the juvenile justice system in far greater numbers than they are represented in the general population. These disparities are most profound at the very front door of the juvenile justice system and at the deepest end of the system in secure confinement. They are also most profound for Black youth.
This blog primarily focuses on the overrepresentation of Black youth in the juvenile justice system. Digging into the data on disproportionality is a critical first step in developing effective strategies to address it.
The Straight Percentages
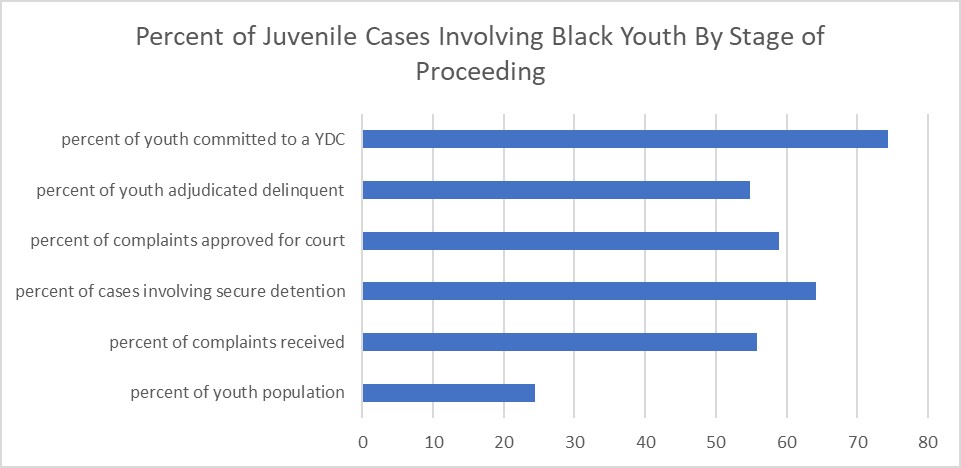
One frame of reference that can be used to consider the role that race and ethnicity plays in the juvenile justice system is simply the percent of Black youth in the overall population compared to the percent of Black youth involved at various juvenile justice system points. The graph below illustrates these percentages as described in the Assessment Study. It shows that while Black youth make up approximately one quarter (24.4%) of the overall youth population, they make up at least half of the youth at each juvenile justice system point studied and nearly three quarters (74.4%) of youth committed to the most secure level of confinement, a Youth Development Center (YDC).

Relative Rate Index
As described in the Assessment Study, the relative rate index, or RRI, “is the ratio of the proportion of minority youth at a given stage to the proportion of White youth at that same stage. If both groups are being processed at the same rate, then the RRI would be equal to 1. RRIs above 1 indicate disproportionate minority contact at that stage of the system.” Assessment Study, p. 17.
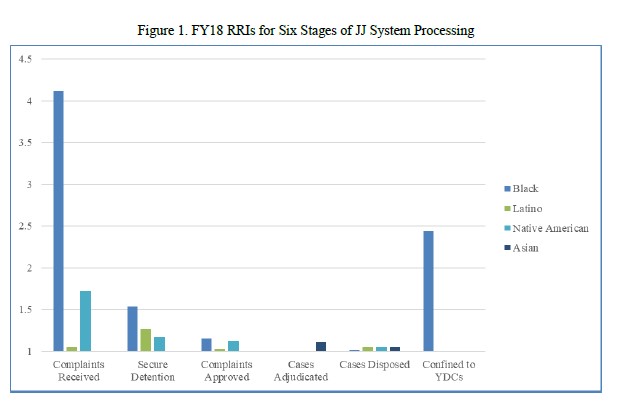
The RRI provides a different framework than a straight percentage because the population used for measurement is the population that was present in the previous processing stage, not the general population of youth. For example, data used to calculate the RRI for complaints that are filed in court following intake is based on the population of youth for whom complaints were initially received by juvenile justice for intake. This structure is intended to identify new disparities that may arise at each stage of system processing instead of looking at the overall youth population. Figure 1. from the Assessment Study, pictured below, shows the statewide RRI for Black youth is over 4 for complaints received at juvenile intake, the very beginning of the juvenile justice system. It also shows an RRI of nearly 2.5 for commitment to YDCs. Additional, less extreme, disparities are shown for other system processing points and for Latino, Native American, and Asian youth.
Local Variation
The Assessment Study analyzed RRIs at the county and regional levels. That analysis included counties with 50 or more cases at the particular processing point. For example, 74 counties received 50 or more delinquency complaints, so an RRI for complaints received was calculated in only those 74 counties. Those calculations resulted in RRIs greater than 1 for Black youth in 69 of the 74 counties. There was also variation across counties with RRIs above 1 for Black youth. Edgecombe and Durham counties stood out with extremely high RRIs, reaching 36 and 23, respectively. The lowest RRIs (in counties with over 3,000 youth) were in Cleveland and Robeson counties, which were at 2.47 and 2.57 respectively. Variations like these were found at every system point studied, although none of the other system points had the extreme highs present in Edgecombe and Durham counties for complaints received.
YDC Commitment RRIs
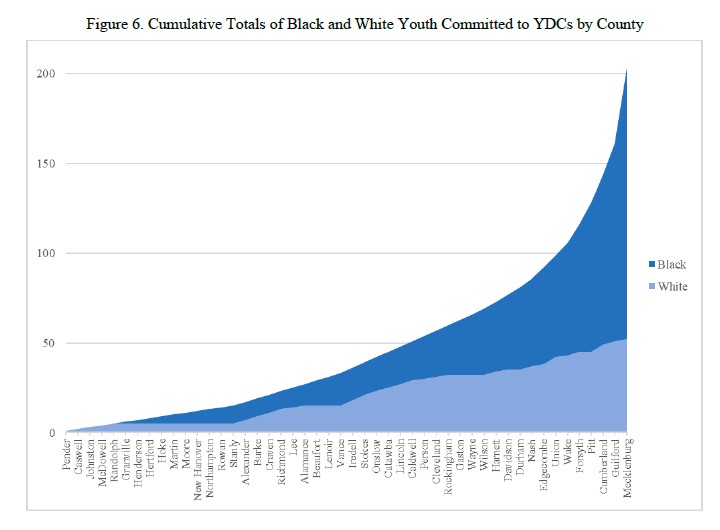
Because the RRI is a ratio that compares the number of minority youth to the number of White youth who receive the same system outcome (i.e., have a complaint filed against them, receive a disposition of commitment to a YDC, etc.), the RRI can only be calculated when there is a population of White youth who experience the system outcome. According to the Assessment Study, this fact made county-level RRI calculation impossible in 24 of the 48 counties that committed at least one youth to a YDC during the study period (2017). None of the committed youth in any of those 24 counties were White. The Assessment Study provided the Figure below to show cumulative totals of Black and White youth committed to a YDC for each of the 48 counties. That figure shows that almost three out of every four youth committed to a YDC were Black.
Case Processing Analysis
The Assessment Study also included an analysis of the predictors of case processing and case outcomes in the five counties with the largest juvenile populations—Cumberland, Forsyth, Guilford, Mecklenburg, and Wake. The analysis took many factors that might influence case outcomes into account, such as the type and severity of offense, the number of charges, the number of prior referrals for the juvenile, and each juvenile’s risk score. They also included demographic factors such as race and ethnicity, age, and gender. The researchers were able to identify which of the studied factors influenced decision making at the various system points analyzed.
This analysis found significant racial and ethnic disparities in juvenile intake decisions (whether to approve, divert, or close each case) across the five counties. For example, Black youth were significantly more likely to have their cases approved for court than White youth in Mecklenburg while Black youth were significantly more likely than White youth to be placed on diversion than to have their case closed in Forsyth.
Race effects were largely not found at the other decision points studied in the case processing analysis, except that Black youth were less likely to be adjudicated delinquent than White youth in Mecklenburg County and both Black and Latino youth were less likely to be adjudicated delinquent than White youth in Wake County.
The case processing analysis also revealed that the legal variables of offense severity and number of prior referrals to the juvenile system were predictive of case outcomes at every decision point studied. The authors noted that while race effects were found, especially at the decisions made at the very beginning of the system, they were not implying that decisions were being made solely on the basis of race and ethnicity without regard to other factors. They concluded that legal factors as well as race and ethnicity affect case outcomes, and they raised the question of whether there might be a relationship between these two sets of variables.
What Does it all Mean?
The three different frameworks provided in the Assessment Study both answer and raise questions. The data clearly show that Black youth are represented in far greater proportion throughout the juvenile justice system than they are represented in the overall population of youth in North Carolina. There is consistency in finding substantial disparity at the very beginning of the juvenile system across each analysis. It is also clear that the highest level of secure juvenile confinement, the YDC system, is made up primarily of Black youth.
Questions remain. The Assessment Study does not answer many questions that will be raised regarding the disparity at the beginning of the system. This includes questions related to differential crime rates, differential policing strategies, and differential access to the social determinants of health (such as economic stability, healthy neighborhoods, and high-quality health care and education systems). Many questions also remain regarding the stark disparity in commitments to a YDC. Those include whether there is a third factor that is connecting legal factors and race and ethnicity in some way (such as bias in the risk assessment instruments that are being used), whether variables such as home stability or prior failed placements are playing an independent role in this outcome, and whether different interventions made at earlier points in the system may function to reduce the disparity.
If you are interested in learning more about the importance of data in addressing racial and ethnic disparities in the juvenile justice system, you can find a Racial and Ethnic Disparities Reduction Practice Manual produced by the Center for Children’s Law and Policy, Case Studies of Nine Jurisdictions that Reduced Disproportionate Minority Contact in their Juvenile Justice Systems authored by the Development Services Group, and the International Association of Chiefs of Police publication of findings from a summit of 90 law enforcement leaders across the United States in Law Enforcement’s Leadership Role in Juvenile Justice Reform, Actionable Recommendations for Practice & Policy. These are just a few of the many resources produced in response to racial and ethnic disparities in the juvenile justice system.