We previously reported on North Carolina state and county-level criminal charging data. In our earlier report (here) we provided data on charges, charged defendants and charged cases for felonies and misdemeanors, and broke misdemeanors down into non-traffic and traffic offenses. In this report, we present more detailed information about the nature of the felony and misdemeanor charges brought in North Carolina in 2019. For felony offenses, we provide data at the state and county level on, among other things, the number of non-violent and violent felony charges, and separate out drug charges. At the misdemeanor level, we parse the data into still more categories, including breakdowns for, among other things, DWI and related charges, non-DWI traffic charges, ordinance violations, and non-violent and violent misdemeanor charges. There is a lot to unpack in our new spreadsheet. In this report, we present some of the top line results. A spreadsheet with the data is available here.
Statewide Data—Felonies
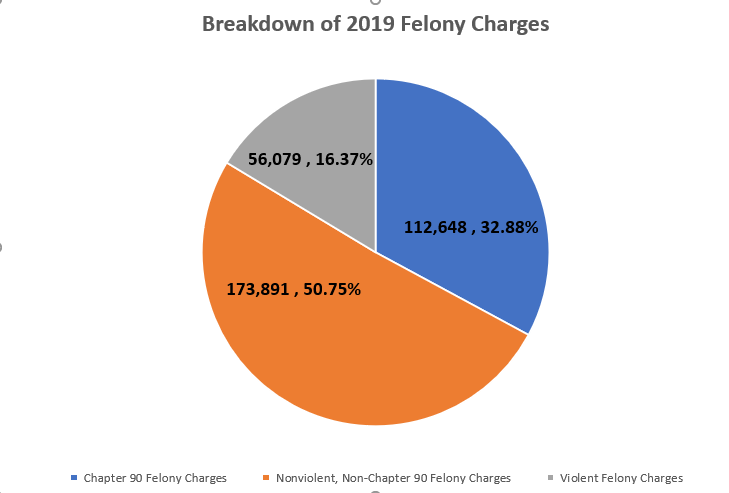
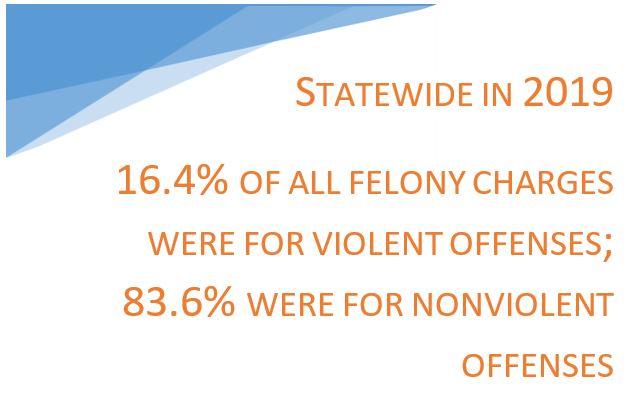 Our analysis shows that violent crimes constitute a relatively small percentage of all charged crimes, for both felonies and misdemeanors. In 2019, there were 342,618 felony charges statewide. Only 16.4% of those charges were for violent crimes; 83.6% were for nonviolent offenses. Felony drug crimes make up almost 33% (112,648 charges) of total felony charges. Even when felony drug charges are removed from the analysis, violent offenses constitute only 24.4% of the remaining felony charges. As described below, we took a liberal approach to categorizing offenses as violent or nonviolent. For example, even though burglary does not include an element of violence, we categorized it as violent on the reasoning that such a categorization best aligns with the seriousness that judicial system stakeholders and citizens attach to that offense. We took a similar approach with other felony offenses, and we describe our categorization rules below.
Figure 1: Breakdown of 2019 Felony Charges
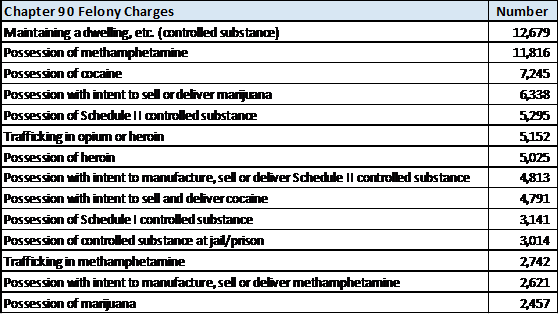
With respect to violent felony charges, only 14 offenses, shown in Table 1 below, had over 1,000 charges statewide. Armed robbery tops that list, with 5,176 charges, followed by indecent liberties with 4,621 charges. Table 2 below presents the most commonly charged nonviolent felonies. Obtaining property by false pretenses tops that list. It is followed by two breaking or entering offenses—felony breaking or entering and breaking or entering a motor vehicle—with 14,388 and 13,941 charges respectively. We categorized drug offenses as nonviolent felonies, and several of those crimes show up in Table 2. Because Chapter 90 drug felonies constitute so many of the charged felonies in 2019, we include Table 3 below, showing the most commonly charged drug offenses. As shown there, maintaining a dwelling was the most charged drug felony (12,679 charges), followed by possession of methamphetamine (11,816 charges).
Table 1. Most commonly charged violent felonies—2019
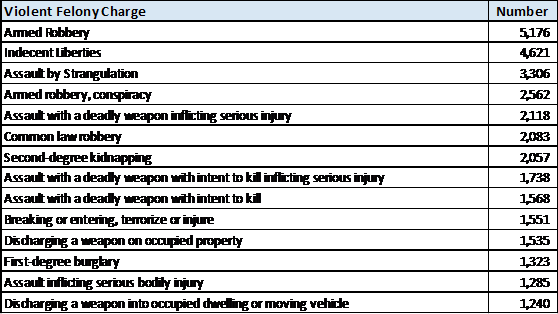
Table 2. Most commonly charged nonviolent felonies—2019
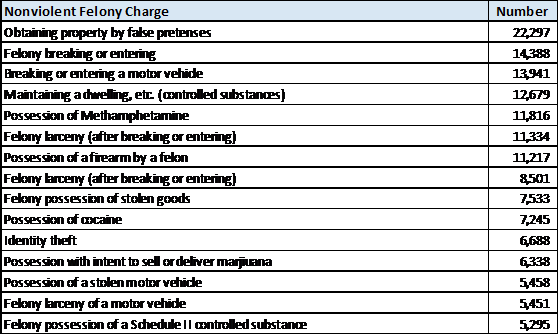
Table 3. Most commonly charged Chapter 90 drug felonies—2019
Statewide Data—Misdemeanors
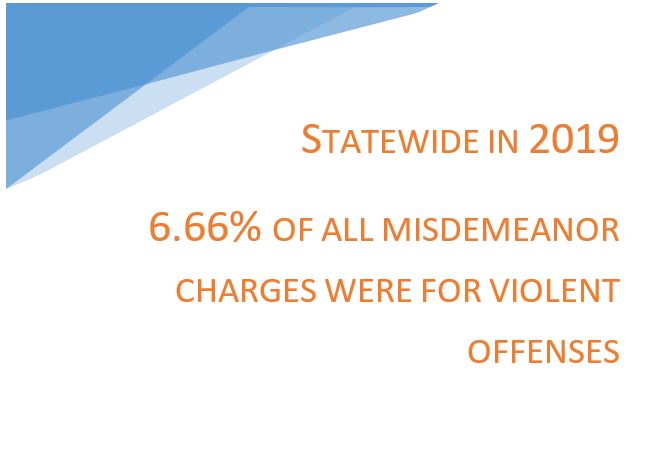
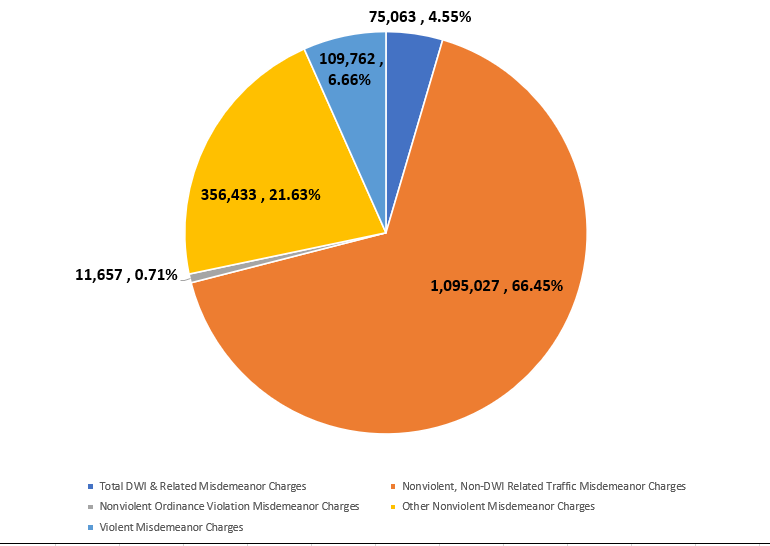
 In 2019 there were 1,647,942 total misdemeanor charges statewide. Of those charges, only 6.66% (109,762 charges) were for violent misdemeanor offenses. The remaining charges were for DWI and related offenses (75,063 charges) and nonviolent misdemeanor charges (1,463,117). Within the latter group of charges—nonviolent misdemeanors—non-DWI related traffic misdemeanors constitute the lion’s share of that total (1,095,027 charges). The remaining charges are for ordinance crimes (11,657) and other nonviolent misdemeanors. The most common specifically designated ordinance charges were for open container of alcohol, failure to provide proof of fare, and begging.
Figure 2. Breakdown of 2019 Misdemeanor Charges
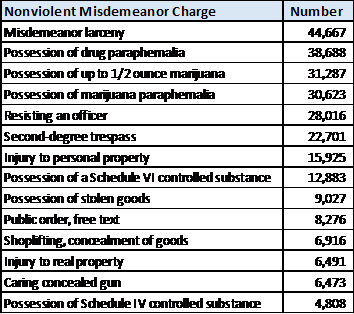
Tables 4 and 5 below show the most commonly charged violent and nonviolent misdemeanor crimes. Misdemeanor larceny tops the nonviolent misdemeanor list, with over 44,000 charges statewide, while assault on a female tops the violent misdemeanor list, with over 27,000 charges. As with felony offenses, we took a liberal approach to categorizing misdemeanors as violent crimes. For example, although communicating threats does not include an element of physical violence, we categorized it as violent on the reasoning that that approach was in line with how judicial system stakeholders and community members view that offense. More detail on our categorization rules is provided below.
Table 4. Most commonly charged violent misdemeanor offenses—2019
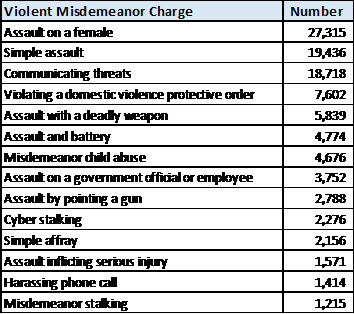
Table 5. Most commonly charged nonviolent misdemeanor offenses—2019
County Level Data
As is often the case with criminal justice data, statewide numbers can disguise significant variability at the county level. As noted above, violent felonies constituted 16.4% of all felony charges statewide. At the county level, however, the range for that percentage was significant. At the low end, only 3.7% of all felony charges in Camden County were for violent offenses. At the high-end, 35.7% of all felony charges in Northampton County were for violent offenses. Similar variability is seen with respect to misdemeanors. At the state level, violent misdemeanors constituted 6.7% of all charged misdemeanors. But again, the range for that percentage is significant at the county level. At the low end, only 1.7% of all misdemeanor charges in Tyrrell County were for violent offenses, but at the high-end, that percentage was 16.7% in Graham County.
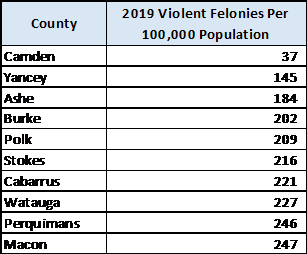
Our county level data also includes per capita rates for charging of violent offenses. The 10 counties with the highest per capita violent felony charging rates are shown in Table 6 below. Interestingly, these are not predominantly metropolitan counties. In fact, only one county that is in the top 10 most populous counties is on that list (Cumberland). Table 7 below shows the per capita violent felony charging rate for North Carolina’s 10 most populous counties. The 10 counties with the lowest per capita violent felony rates are shown in Table 8 below. The spreadsheet accompanying this report also provides per capita charging rates for violent misdemeanor offenses.
Table 6. Counties with the highest per capita violent felony charging rate — 2019
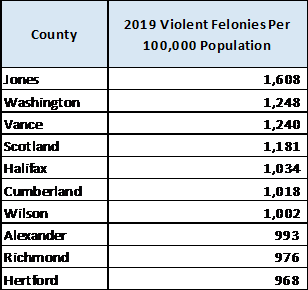
Table 7. Per capita violent felony charging rate for North Carolina’s 10 largest counties (by population) — 2019
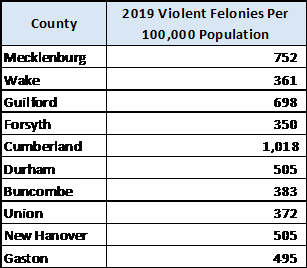
Table 8. Counties with the lowest per capita violent felony charging rate — 2019
Methodology
As with our prior report, this analysis was conducted using the North Carolina Administrative Office of the Courts “Tally Report.” Detailed notes of how we processed the data in that report are contained in our spreadsheet’s “Read Me” tab. For purposes of categorizing offenses as violent and nonviolent, we categorized general crimes the same as the main offense. For example, we categorized attempted robbery as violent, like robbery. Some offenses are obviously violent, such as first-degree murder, or nonviolent, such as food stamp fraud. A table showing how we categorized other offenses is included in the “Read Me” tab in our spreadsheet. It clarifies, for example, that we categorized gang offenses as violent and disorderly conduct as nonviolent. This report includes additional detail on specific offenses, not included in the spreadsheet noted above. If you are interested in learning more about your county’s experience, please reach out and we will try to help you.
Graduate Research Assistant Ross Hatton and Legal Research Associate Christopher Tyner coauthored this post.
