We have issued a series of reports on North Carolina state and county-level jail occupancy rates, including one in July 2020 focusing on changes in jail occupancy rates during the early months of the COVID-19 pandemic (here, here and here). In this report, we switch our reporting metric and focus on changes in occupants as opposed to occupancy rates. We also provide a new tool for stakeholders to examine changes in county jail populations during the COVID-19 period.
This report includes data through July 2020. Please refer to our prior reports for information on data sources and calculations.
State Level Data
As shown in Figure 1 below, in January and February 2020, jails statewide were detaining over 20,000 people. These numbers were higher than those for the same months in 2019. In March 2020, the beginning of the COVID-19 pandemic, jail detentions statewide dropped to 19,318. By April 2020, statewide jail detentions had dropped to 15,215, and have continued to fall, albeit at a slower rate, monthly through July 2020. Statewide detention rates for April, May, June, and July 2020 were below detention rates for the same months in 2019.
Figure 1. Number of individuals detained in jail statewide—2019 and 2020
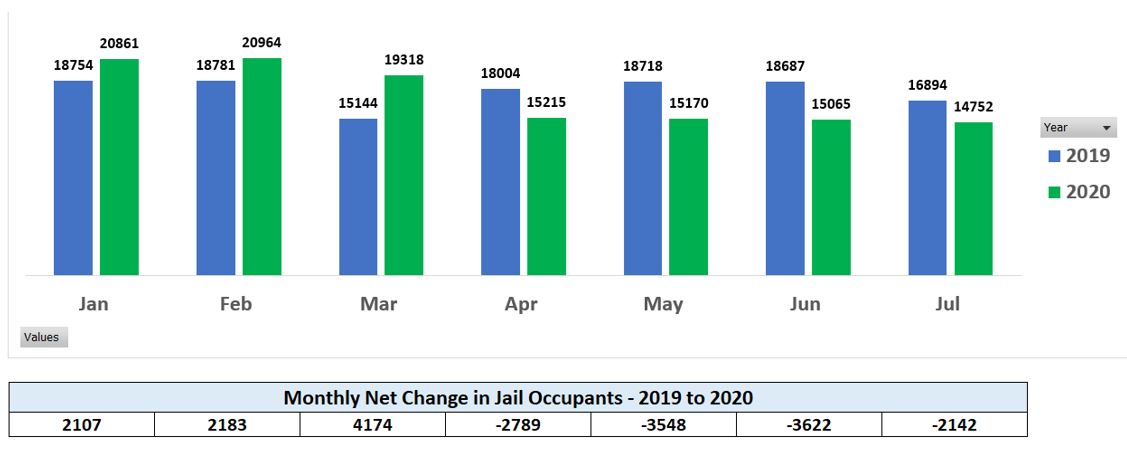
Note: The figure above shows a significant decline in the statewide jail population in March 2019. However, in March 2019 a large number of facilities—40 of 114—did not report jail data. As a result, the March 2019 figure is artificially low.
County Level Data
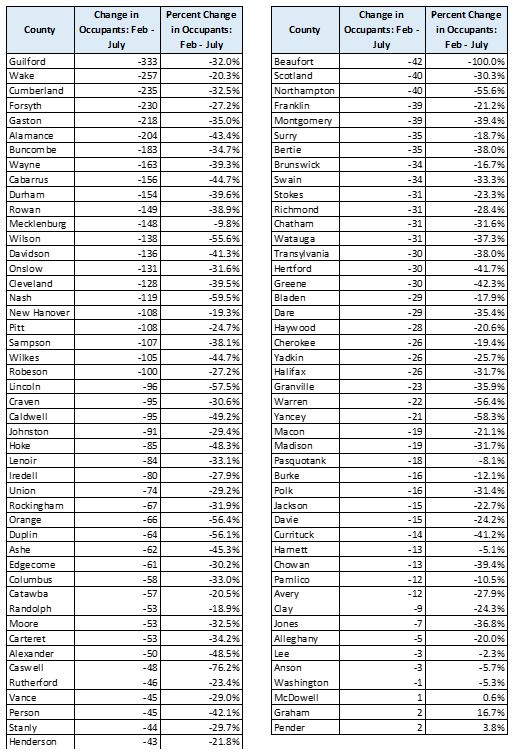
As we have seen in prior reporting, statewide data can disguise disparities at the county level. Thus, we examined changes in county level jail populations, focusing first on the period from February 2020 (immediately before the onset of the COVID-19 pandemic) to July 2020. For this period, 90 of the 93 counties (96.8%) with facilities accepting occupants had fewer occupants in July than in February 2020. Population declines in these counties ranged from 1 to 333 persons, or 2.3% to 76.2%.[1] Three counties experienced an increase in occupants from February 2020 to July 2020. The range of increases was 1 to 2 occupants, or 0.6% to 16.7%. Table 1 shows these changes for all counties.
Table 1. County level changes in jail occupants—February to July, 2020
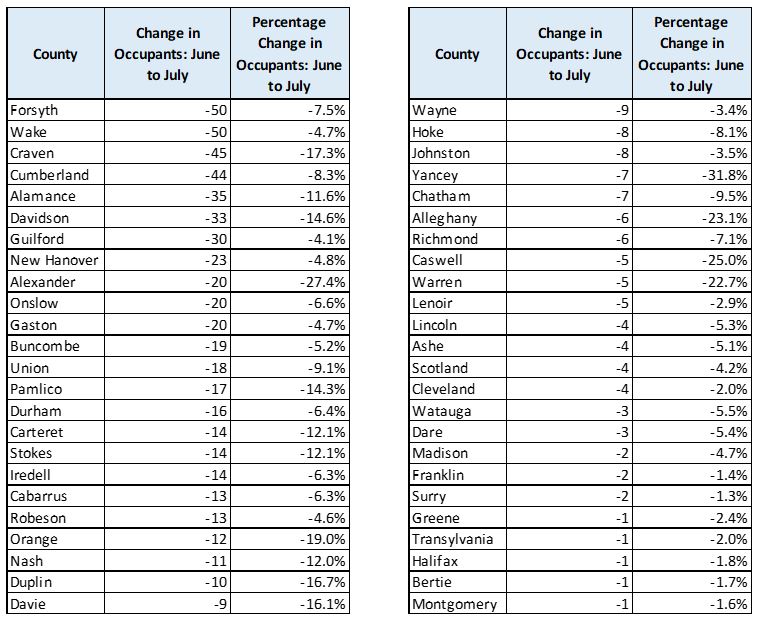
Because we were interested in whether the halt in jury trials and other criminal procedure changes were impacting jail populations over a shorter term, we also compared changes in county jail populations from June to July 2020. Of the 92 counties with open facilities during that period,[2] 48 counties (52%) experienced decreases in jail populations (Table 2). Decreases ranged from 1 to 50 occupants, or 1.3% to 31.8%.
Table 2. Counties with Decreases in Jail Population—June to July 2020
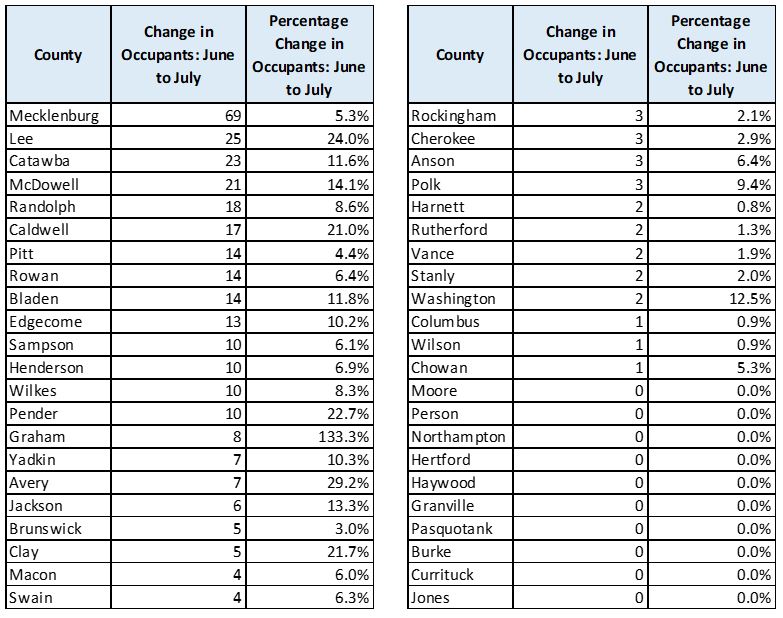
However, 34 counties (37.0%) experienced an increase in the total number of occupants and 10 (11%) experienced no change in that number (Table 3). Increases ranged from 1 to 69 occupants, or .8% to 133.3%.
Table 3. Counties with Increases or No Change in Jail Population—June to July 2020
As noted above, nearly all counties experienced declining populations from February 2020 to July 2020. The fact that only 52% experienced declines from June 2020 to July 2020 and a number stayed flat or increased during that period may signal a “tail end” change in the declining population trend seen when examining the longer February to July period.
New Tool for Stakeholders
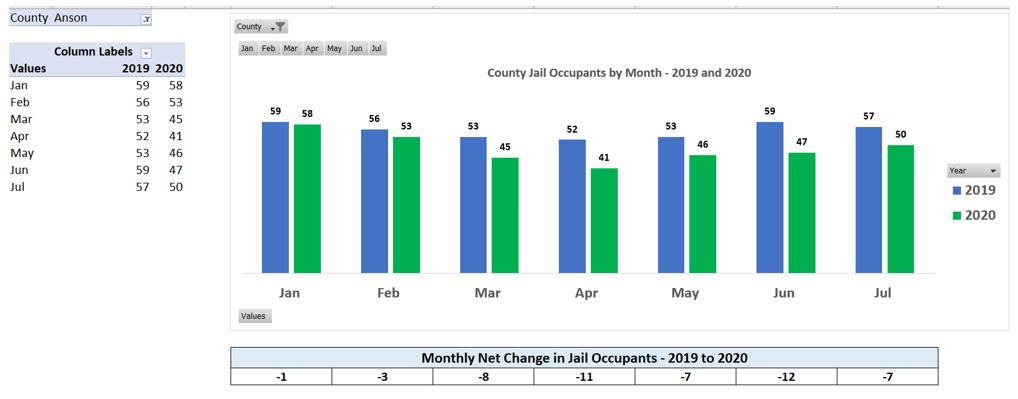
Finally, because we have fielded so many questions about county level jail populations during the COVID-19 period, we created a new tool allowing stakeholders to examine their local jail populations throughout the COVID-19 period. We present, for example, the graph for Anson County in Figure 2 below.
Figure 2. Sample County Graph & Associated Data—Anson County

Instructions for accessing the tool:
- Click on the spreadsheet here
- Click on the spreadsheet tab entitled Occupants Graph
- Open the drop-down menu in the first cell
- Deselect “All” and select the county you wish to display; the table will automatically update
* * *
We will continue to update this work as new data becomes available.
This post was coauthored by Graduate Research Assistant Ross Hatton.
[1] Beaufort fell 100% compared to 2019 due to the facility closing. This range reflects the next largest decline for a facility that remained open in 2020.
[2] Beaufort was removed from this calculation as it remained closed from April through July.
