A defense lawyer from another state recently asked me if it was possible to get probation for involuntary manslaughter in North Carolina. It is apparently possible but uncommon in his state, so he was looking to other jurisdictions to craft a sentencing argument in favor of a non-incarcerative sentence for his client. Within seconds, I was able to tell him that 38 percent of involuntary manslaughter convictions in North Carolina were sentenced to probation last year. He couldn’t believe I had that sort of information on hand. I told him that it came from the annual statistical report prepared by the North Carolina Sentencing and Policy Advisory Commission. I didn’t send him the link to the full report, for fear that it would blow his mind.
But surely readers of this blog can handle it. Officially titled the Structured Sentencing Statistical Report for Felonies and Misdemeanors, it’s a gold mine of data. It includes information that strikes me as valuable to many different groups, for many different purposes.
Anyone who reads this blog would be interested in the the two-page summary (p. iv–v) that opens the report. There you can learn (among other things) that of the 28,000 felony convictions in North Carolina in Fiscal Year 2011/12:
- 44 percent were Class H felonies.
- 85 percent were for male defendants.
- 50 percent were for Black defendants.
- 5 percent were sentenced in the aggravated range.
- 30 percent were ordered to pay restitution.
Some other data highlights sprinkled throughout the report:
- December and June are the months with the fewest convictions; August has the most (p. 3).
- 26 percent of all felony convictions are district court guilty pleas to Class H and I felonies (p. 8).
- 70 percent of habitual felon convictions are sentenced in the mitigated range (p. 31).
- The 60-month firearm enhancement in G.S. 15A-1340.16A was used exactly once statewide last year (p. 33). (I bet the new version, which Jeff described briefly here, will be used more frequently.)
Judges, the report provides a window into your collective sentencing practices—which is helpful, because you don’t always have an opportunity to converse with your peers. Table 4 (p. 13–14) is particular favorite of mine, showing the average minimum and maximum sentence and dispositional prevalence (that is, the relative use of active, intermediate, and community punishments) in every cell on the grid. Here is a snippet for Class G:
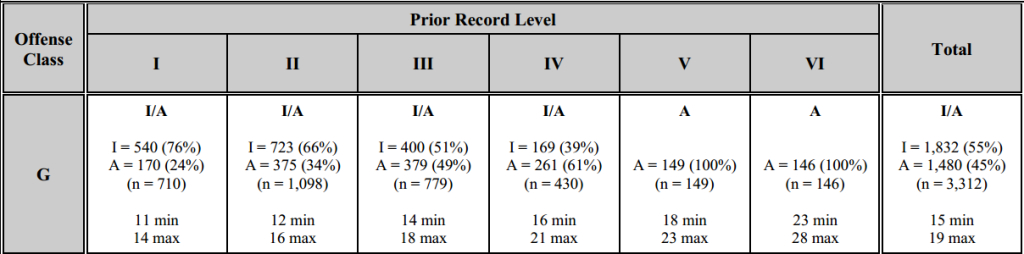
It’s a very quick way to measure a proposed sentence against the “average” defendant in that cell, adjusting from there as necessary in light of the specific facts of the case.
Advocates—like the lawyer I mentioned at the beginning of this post—may wish to review of Appendix D, Table 1 (p. 75–77), which shows the average term of imprisonment and dispositional prevalence broken down by offense. For instance, the average sentence of imprisonment for Class F indecent liberties with a child is about 17–21 months, and the breakdown of active and intermediate punishments is almost exactly 50/50. Class F assault with a deadly weapon on a government officer has a similar average term of imprisonment, but yields an active sentence 73 percent of the time. Knowing the average sentence can strengthen an argument for more, less, or different punishment in a specific case.
Prosecutors may be particularly interested in the tables that break data down by judicial district. Tables 1 and 2 of Appendix C (p. 65–70) show the average term of imprisonment, dispositional prevalence, and frequency of use of the presumptive, aggravated and mitigated range by judicial district. Table 2 (p. 4–8) and Table 17 (p. 39–42) show the mode of disposition (guilty plea or jury trial) of all convictions for felonies and misdemeanors, respectively, by district and county. It is interesting to see how the districts differ, and perhaps a helpful way for decision makers to take stock of their work.
There is much more. The Statistical Report is one of several Sentencing Commission publications that I have on my desk at all times; the annual Recidivism Report is another must-read. I hope you’ll take a look if you haven’t already.
This is perhaps the best post ever for you, Jamie. statistics + gifs = win.
December and June are easy to explain – December – Christmas and June – Judges/DA’s Conference 🙂
Thank you VERY much.
This post clearly qualifies as infotainment. Thanks, Jamie!
I can handle it; and don’t call me Shirley…