Local jails are an important part of the state’s criminal justice system. Jails house, among others, individuals held pretrial, serving sentences, and held for federal and other authorities. In this report and in the accompanying spreadsheet (here), we provide information about North Carolina jail occupancy rates. Among other things, we find that:
- 40.6% of counties[1] exceeded in-county jail capacity for at least one month in 2019; and
- 56.3% of counties exceeded 90% of in-county jail capacity for at least one month in 2019.
Our report relies on information reported to state authorities. Specifically, the North Carolina Administrative Code requires the sheriff or the administrator of a regional jail to submit a monthly report to the Jail and Detention Section of DHHS’ Division of Health Service Regulation.[2] Police chiefs likewise are required to report monthly on the occupancy of municipal lockups.[3] According to DHHS, those required to report do not include a count of inmates housed in other counties; rather they count only individuals physically present in the facility.[4] A jail that is housing individuals for another county would include those persons in its count.[5] We obtained a compilation of reported data from DHSS and it serves as the basis for this report.
Before we present our results, several notes are in order. First, because the Administrative Code does not require reports to break down jail populations by detention type (e.g., serving a sentence, pretrial), our analysis is limited to overall jail populations. Second, reporting is done by facility. To arrive at county-level data, we located each facility and combined data to arrive at county-level numbers. Third, notwithstanding the requirements of the Administrative Code, reporting to DHHS is incomplete. Specifically, jail populations were not consistently reported for all facilities for all months. Fourth, some facilities are listed in the DHHS report as having capacity but in fact were damaged or otherwise not in commission, and thus did not accept occupants in 2019. Because we wanted to understand 2019 jail occupancy rates in confinement facilities that were fit to accept occupants, we had to address these last two issues or risk understating occupancy rates. To do that, we took two steps. First, we contacted local officials to identify jails that were unable to house inmates. For each such facility, its capacity was removed from the totals.[6] Second, when a jail was missing monthly data due to failure to report, capacity for that month was removed from calculation of monthly occupancy rates to avoid deflating those rates. Third, if a jail does not ever accept long-term occupants, its capacity was removed.[7] Finally, a large jump in occupancy caused us to reach out to one jail. From that contact we learned that the county had opened a new, larger facility and that new capacity was not reflected in the DHHS report. We adjusted that county’s capacity accordingly. A full spreadsheet of our results is available at the link provided above; the spreadsheet’s Read Me tab documents all of the issues discussed here.
Occupancy Rates—Generally
Statewide in 2019 the average jail occupancy rate was 78.2%. North Carolina jails reported an annual capacity of 23,049 and an average statewide jail population of 18,021.[8] Monthly statewide occupancy rates ranged from a low of 73.9% in March to a high of 81.5% in September.
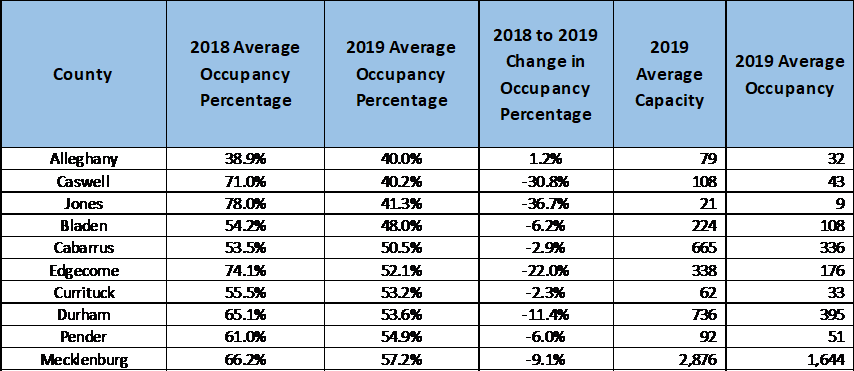
At the county level, 2019 occupancy rates ranged from a low 40% to a high of 147.1%. The tables below show the ten counties with highest average 2019 occupancy rates and the ten counties with the lowest 2019 occupancy rates.
At the facility level, occupancy rates at facilities that housed occupants ranged from a low of 26.9% to a high of 147.1%.
Table 1: Ten Counties with the Highest 2019 Occupancy Rates
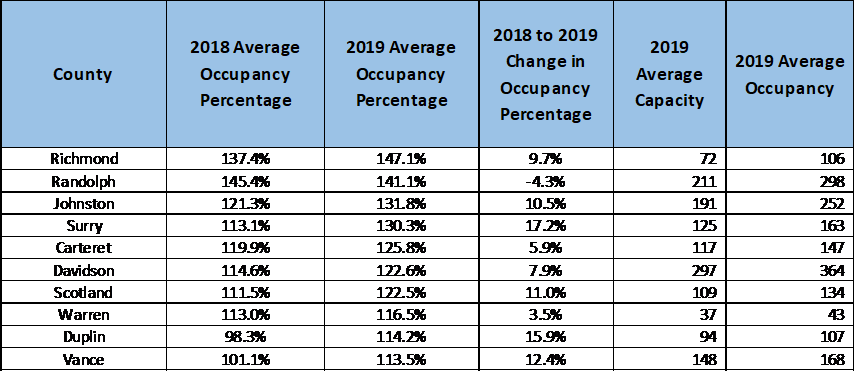
Table 2: Ten Counties with the Lowest 2019 Occupancy Rates
Occupancy Rates—Over-Capacity Jails
For 2019 as a whole, 18 of the 89 counties that have operating jails and reported data[9] exceeded their average in-county capacity. Of these counties, occupancy ranged from 100.1% to 147.1%.[10] An additional seven counties have no in-county operating jails[11] and are required to house detainees elsewhere; for purposes of this analysis we treat these counties as over-capacity. Thus, 26.4% of the 96 counties in our analysis exceeded local jail capacity for 2019 as a whole when including jurisdictions that have no in-county facilities housing occupants.
To further examine pressure on jail capacity, we looked at jails that exceeded 90% of capacity. The table immediately below lists 36 counties that experienced capacities exceeding 90% for all of 2019.[12]
Table 3: Counties Exceeding 90% Capacity in 2019

However, these average annual numbers gloss over individual months when some counties exceeded capacity. In fact, monthly data show that 39 of 89 the counties that have operating jails and reported data[13] (43.8%) exceeded in-county capacity for at least one month in 2019. When the seven counties that have no operating jails are added to this total:
- 40.6% of counties exceeded in-county jail capacity for some part of 2019; and
- 56.3% exceeded 90% of in-county jail capacity for some part of 2019.
Individual facility data showed similar results. Of the 105[14] facilities listed in the confinement report, 21 (20%) had an average occupancy above 100% for the year. An additional 17 facilities had average occupancies above 90% for the year. Thus, 36.2% of North Carolina facilities were above 90% occupancy on average. Forty-five facilities (42.9%) were above 100% during one or more months in 2019. Sixty-two facilities (59%), experienced occupancy of 90% or more during one or more months in 2019.
* * *
The data demonstrate that there is a significant spread in occupancy rates at both facility and county levels. With a range of 40% to 147.1%, North Carolina counties are experiencing substantially different occupancy rates. A significant number of counties and facilities experienced occupancy in excess of official capacity either on average or during one or more months in 2019. Approximately 26.4% of counties and 20% of facilities were in excess of official capacity on average, and 40.6% of counties and 42.9% of facilities experienced excess occupancy for at least one month during 2019. These numbers grow significantly larger when including any facility or county above 90%. For both counties and facilities, a majority were above 90% at some point during 2019.
This paper does not seek to explain deviations in occupancy or critique county and facility practices. Rather it presents 2019 jail occupancy rates and provides data on counties and facilities that are over or near capacity. As noted above, reporting to DHHS includes only inmates physically present in the facility; it does not include inmates under local supervision but housed out-of-county. If a county or facility is housing individuals elsewhere because of capacity issues, the DHHS data may understate pressure on capacity. Data on total number of inmates under supervision is maintained by the local jails and may be an additional information source for those wishing to explore this issue further.
Any input, suggestions, or questions are appreciated as we continue to analyze and communicate these findings, which we plan to update annually. The spreadsheet noted above contains the county and state data discussed here.
Ross Hatton, UNC MPA Graduate Research Assistant, coauthored this post.
[1] Macon, Pamlico, and Wilson had operating facilities but did not report occupancy in 2019 and were excluded from this analysis. Beaufort’s capacity varied in 2019 and was excluded due to our inability to calculate occupancy.
[2] 10A NCAC 14J, § .1101.
[3] 10A NCAC 14J, § .1728.
[4] Email from Chris W. Wood, Chief Jail Inspector, Division of Health Service Regulation, Construction Section, NC DHHS to Christopher Tyner, Research Associate, UNC School of Government, Oct. 2, 2019 (on file with authors).
[5] Id.
[6] Jones County Jail from January through June and the Wake County Detention Center Annex for all of 2019.
[7] Ayden City Municipal Jail, Farmville City Municipal Detention Center, and Hyde County Ocracoke Jail.
[8] Beaufort’s average occupancy is not included in the statewide total due to its missing capacity.
[9] As noted in footnote 1, three counties had operating facilities but did not report data. The facility in one other county—Beaufort—had mechanical issues throughout 2019 causing its actual capacity to vary throughout the year. Because no record of actual capacity is available for that facility, we were unable to determine average or monthly capacities and thus excluded Beaufort from our analysis.
[10] Caldwell has 100% average occupancy in the accompanying spreadsheet, but this is rounded from 99.96%.
[11] Camden, Gates, Hyde, Martin, Mitchell, Perquimans, and Tyrrell counties have no in-county jail accepting occupants.
[12] This table does not include the above seven counties, as they have no occupancy rates.
[13] See footnote 9.
[14] Excludes facilities were not accepting occupants in 2019, did not report 2019 data, never accept long-term occupants, or had varying capacity that could not be determined. These nine facilities are: Ayden City Municipal Jail, Beaufort County Detention Center, Bladen County Jail, Farmville City Municipal Detention Center, Hyde County Ocracoke Jail, Macon County Detention Center, Pamlico County Detention Center, Wake County Detention Center Annex, and Wilson County Detention Center.
Dose this count include persons in federal custody that are housed under contract in county jails?